Background
The X45e units can be used for logging events. This is useful for measuring cycle times on a function motor, to tune in movements and for trouble shooting. This article focuses on how to generate a log file but also how to process the logging data further in Microsoft Excel.
For deeper information please check the following manuals:
- User documentation – Electrical System (X45e)
- User documentation – Parameter Setting Tool
Prerequisites
Hardware
- PC (Windows 7 or later)
- X45e units (with power cables)
- Parameter Setting Tool cable (X45e) or mini USB cable depending on hardware version
Software
- X45e – Parameter Setting Tool
- Microsoft Excel or equivalent
Prepare the X45e unit
First of all the X45e units has to be prepared for this logging feature. When this article was written the current motor software version was feg_v059.mot. If the X45e unit contains an older version it is recommended to upgrade to the latest one. All appropriate files can be found and downloaded from the Download area in MyFlexLink.
Capture log data into a file
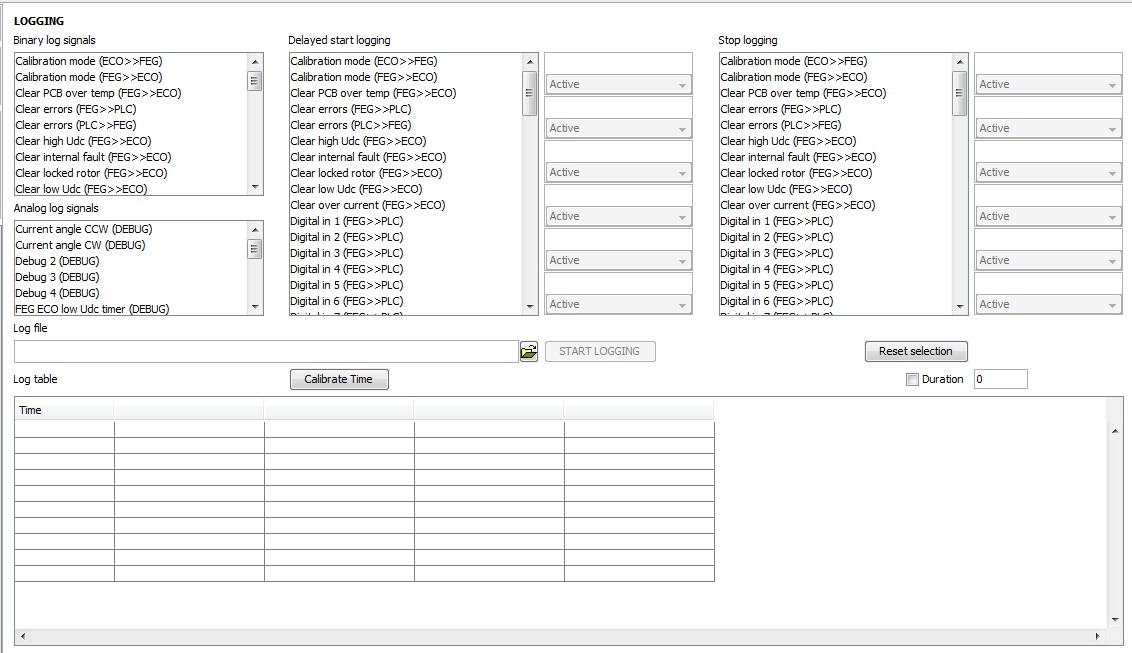
The capturing of log data is done using the Parameter Setting Tool. Make sure the X45e unit is connected via the parameter cable and the network setting is set to X45e -> B-Bus. The hardware version with Ethernet has to be connected via USB cable and the network setting is set to X45e -> USB. Then a Scan network process has to be performed and the node in focus has to be selected. Next step is to open the menu Tools -> Activities -> Logging.
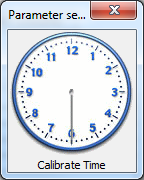
Calibrate Time
It is recommended to run a calibration procedure every time a logging should be performed (CAN-Bus hardware version). Every individual parameter cable (Kvaser) is a bit unique and has to be synchronized with the PST tool. These settings are not remembered by the software and is because of this needed to perform this calibration every time the logging page is opened. When the button is pressed the window below appears for some seconds. When this window disappears the calibration process is completed.
Binary log signals
All selected binary log signal will be logged. They will be logged at every transition. To select more than one signal keep the CTRL key pressed while selecting all signals.
Analog log signals
This list contains all analog signal possible to log. The logging of the analog signals is event triggered on change.
If the logging event should be triggered constantly the signal FEG_low_Udc_timer could be selected. This value changes continuously and new logging event will be triggered as fast as possible.
Delayed start logging
If the logging should start triggered by a digital signal these signals should be selected in the Delayed start logging window. Each signal should have the condition option set. These could be set to a state (Active or Inactive) or a transition (Rising edge, Falling edge or any Transition).
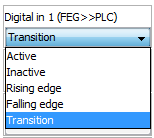
Several signals could be selected. In this case the logging will start if any of them are fulfilled.
Stop logging
It is also possible to specify the condition for stopping the logging. It is done in the similar manner as the delayed start (above).
Log file
All log data are written to an txt file in parallel to the log table (see below). File path and name of the log file are specified here. If an old file is used the browse button can be used to select it.
START/STOP LOGGING (Button)
After all settings are made the START LOGGING button starts the log function. If a delayed start condition is set this is now evaluated and will trigger the actual log data. The button changes text to STOP LOGGING during the logging.
Reset selection (Button)
All settings of signals could be cleaned and set back to default values with the Reset selection button.
Duration
There is also an option to run the logging a certain time. This time in seconds is specified in the Duration window.
Log table
The outcome of the logging function is a txt-file containing all the data including the names of the log signals.

Analyze the data - Microsoft Excel
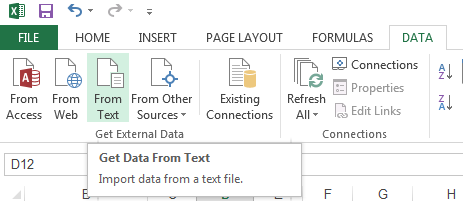
To further analyze this data it is possible to open this file into Microsoft Excel. In Excel 2013 this is done from the DATA menu using the Get Data From Text command.
When setting the options for importing the data it is important to set the Original data type to Delimited and to use the Tab alternative as Delimiters.
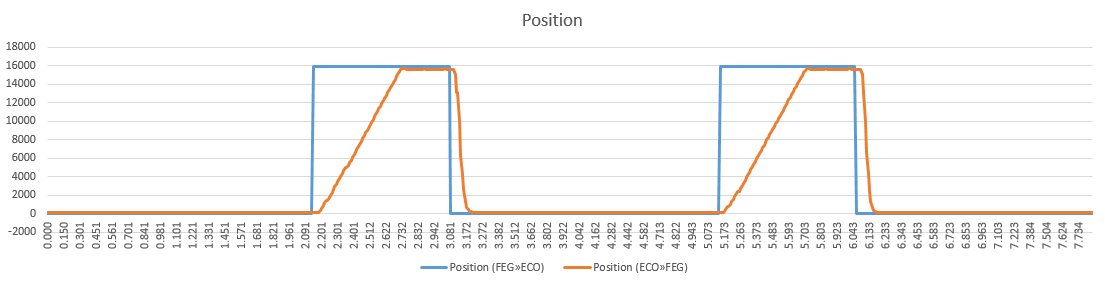
Then it is possible to use this data and create a graph (line chart). In many cases it could be very useful to use the Combo chart type with two different Y-axis. This is especially useful if speed and position are logged.